Plotting Ungrouped Series
Here there are the classes that plot ungrouped series
-
class
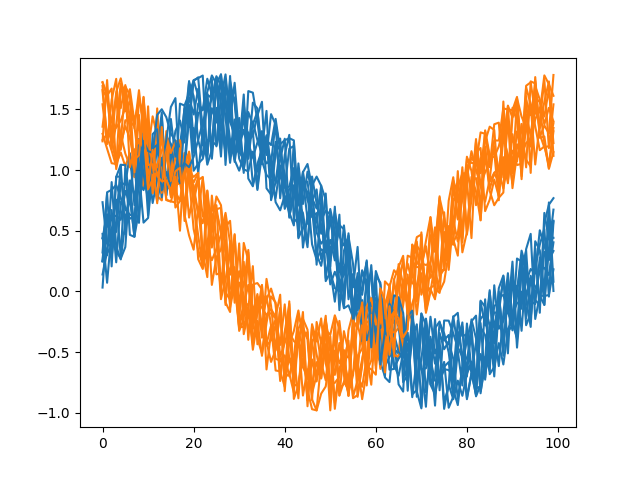
plotszoo.series.SeriesParade(data, column)¶ Plot one column from all the series
- Args:
- data
plotszoo.data.DataCollectionwith some series- column
The column to plot
Example:
import numpy as np
import pandas as pd
import os
import matplotlib.pyplot as plt
import plotszoo

np.random.seed(0)

num_series = 10
samples = 100
noise_level = 0.8
x = np.linspace(0, np.pi*2, samples)
types = []
series = {}
for _ in range(0, num_series):
    noisy_sin = np.sin(x) + np.random.rand(samples)*noise_level
    series[len(types)] = pd.DataFrame(noisy_sin, columns=["value"])
    types.append("sin")
    noisy_cos = np.cos(x) + np.random.rand(samples)*noise_level
    series[len(types)] = pd.DataFrame(noisy_cos, columns=["value"])
    types.append("cos")

data = plotszoo.data.DataCollection()
data.set_scalars(pd.DataFrame(types, columns=["type"]))
data.set_series(series)

fig, ax = plt.subplots()

series_parade = plotszoo.series.SeriesParade(data, "value")

series_parade.plot(ax, color_fn=lambda s: ["sin", "cos"].index(s["type"]))

fig.savefig(os.path.join(os.path.dirname(os.path.realpath(__file__)), "images/SeriesParade.png"))
-
plot(ax, fixed_color=None, color_fn=None, cmap='tab10')¶ Plot the series parade
- Args:
- ax
matplotlibaxes to plot to- fixed_color
color to use for all the plots
- color_fn
function to compute the color from the scalars
- cmap
matplotlibcolormap to use (Default:tab10)